As reports expand their functionality to be an efficient tool for measuring, evaluating and proposing constructive improvement ideas and strategies, rising demands for a good scaling tracking system throughout various E-commerce platforms also drastically escalate. With the latest update of a comprehensive, thorough and detailed Shopify reports and Analytics system, this prince proves their outstanding differences from the rest well-known competitors. What raising here is how to make use of it and turn it over to convert the best ROI for your business, you’ve got it covered!
A. Shopify Reports System
1. Acquisition reports
Acquisition metrics on Shopify reports help to identify where, when and how visitors get access to the website, calculated based on cookies, one for detecting the device, and another for measuring the duration of the session. Every section lasts for 30 minutes no matter how many times the visitor enters the website. Three metrics in the Acquisition report in Shopify includes:
| Sessions over time | Number of sections and visitors within a certain time range |
| Sessions by referrer | Analysis of the sources where visitors access or engage in a session |
| Sessions by location | The countries/regions visitors access to the website |
2. Behavior reports
Behavior reports grant marketers an overview of the session and search function insights, aiming to customize the most appropriate promotional and pricing tactics for certain groups of audiences or potential customers. Detailed explanation of the criteria is in the following table.
| Online store cart analysis | Customer behaviour tracking and analytics by displaying the product list that online customers have added to the same cart during the last 30 days |
| Online store conversion over time | Percentage of online store visitors who manage to purchase successfully within a certain period of time |
| Product recommendation conversions over time | The effectiveness level of the product recommendations within a period of time, measured by the number of conversions successfully made via the product suggestion function. The funnel is crafted by days, sessions, Click rate, add-to-cart rate, and purchase rate. |
| Search conversions over time | Similar measurement to product recommendation, yet include all the conversions conducted by the storefront search function |
| Sessions by device | Types of devices that visitors use to access the online store over a period of time |
| Sessions by landing page | Determination of which page the visitor starts on the whole website |
| Top online store searches | Top search term list that visitors conduct over a period of time, including search terms and number of searches |
| Top online store searches with no clicks | Top search term list that visitors conducted but didn’t get clicks in any of the resulting products/items |
| Top online store searches with no results | Top search term list that visitors conducted but didn’t return any result |
| Top products with low recommendation click rate | The products that your customers viewed the most in the recommendation section yet possessed a below-average click rate |
3. Customer reports
With this Shopify report, helpful insights about customers, including their average order count, average order totals, and expected purchase value are collected and analyzed to keep the business posted on consumer trends, behavior and acquisition.
| Customers over time | Quantity of customers placing orders within a period of time |
| First-time vs returning customer sales | Order value from new and existing customers |
| Customers by location | Total number of new customers, orders and value categorized by locations |
| Returning customers | Data of customers who place orders more than one time (name, email address, first order date, most recent order date, order times, spent amount) |
| One-time customers | Data of customers who place only one order (name, email address, first order date, order value) |
| Customer cohort analysis | Customer acquisition and retention data (cohort analysis table, retention rate chart, cohort analysis details) |
| Predicted spend tier | Anticipated spent value per customer within the selected cohort (customer info, last order date, total order number, total amount spent, estimated upcoming order value range) |
While the data for First-time and returning customer reports are secondly up-to-date, it takes a while to synchronize the data of other customer report fields, normally after 12 hours. Notably, all customers will be listed as existing ones if they place more than two orders, even if the first purchase time is within the selected frame. Shopify reports sort it out by the entire order history of that customer.
4. Finance reports
Finance report stands as a key financial analysis for merchants to identify, evaluate and regulate their sales performance or marketing activities. The breakdown of the criteria is as follows:
| Gross Profit overview | Net sales without cost recorded | Calculated as gross sales – discounts – returns |
| Net sales with cost recorded | Calculated as gross sales – discounts – returns – product cost | |
| Liabilities overview | Gift card sales | Calculated by gift card sale value – discounts at the sold time |
| Gift cards balance | Total outstanding amount of gift cards that were sold or issued at the selected period of time | |
| Tips | Total amount of tips received from customers | |
| Sales overview | Gross sales report | Total amount of sales generated within a period of time |
| Discounts report | A combination of line-item and order-level discount reports, displayed as the discount codes that customers apply during their checkout process | |
| Returns report | Value of goods/orders returned by the customers, displayed as a negative number on the report | |
| Shipping report | Shipping costs raised from purchased or returned orders | |
| Taxes report | Sale taxes applied into the orders within the chosen period of time. Taxes report depends on where sales are heading, meaning they encompass destination details even in regions where sale tax is based on origin. |
5. Fraud reports
Shopify reports on fraud are generated from order data that may indicate fraudulent activity, whether confirmed or suspected. Unlike other reports, fraud reports cannot be tailored to specific preferences. They are accessible across all Shopify subscription tiers. Nevertheless, certain fraud reports will only appear in the Reports list once the relevant feature has been enabled.
| Acceptance rate | Percentage of orders that aren’t marked as high-risk |
| Fraudulent chargeback rate | Percentage of order value that are reimbursed because of ‘fraudulent’ reason |
| Orders canceled due to fraud | Number of orders that are canceled due to fraudulent reason |
| High-risk orders rate | Percentage of orders that are marked as high-risk |
| Overall chargeback rate | Percentage of order value that are reimbursed under any reason |
| Fraudulent chargeback rate | Total order value that is reimbursed because of the ‘fraudulent’ reason |
6. Inventory reports
Inventory reports offer a month-end snapshot of your stock, allowing you to monitor the quantity and percentage of items sold daily. It can take 12 to 72 hours for inventory changes to reflect in Shopify reports.
| ABC analysis by product | Evaluation by grading on the percentage of total sales value that each product variant contributes within the last 28 days A-grade: Top-selling products contributed 80% of the total income B-grade: Products contributed 15% of the total income C-grade: Products contributed 5% of the total income |
| Average inventory sold per day | Number of products sold per day on average |
| Percent of inventory sold | Percentage of products sold within a selected period of time |
| Days of inventory remaining | Anticipation on how long the inventory is remaining, calculated based on the sales and stock remaining data over time. |
| Month-end inventory snapshot | Report on the quantity of items/products left in the inventory by the end of the month |
| Month-end inventory value | Report on the value amount of items/products left in the inventory by the end of the month |
| Product sell-through rate | Percentage of the products sold during a selected period of time |
7. Marketing reports
This kind of Shopify report, available for both Shopify and Shopify Plus merchants regardless of subscription type, provides insights into the effectiveness of your marketing efforts and offer valuable data on conversions. A conversion is registered when a visitor to your online store completes a purchase.
| Sessions attributed to marketing | Total number of sessions that are resulted from marketing activities, including & not limited to UTM campaign, Facebook ads & Google Shopping ads |
| Conversion by first interaction | Total number of orders with clearly stated sources successfully purchased from first interactions |
| Conversion by last interaction | Total number of orders with clearly stated sources of interaction successfully purchased from last interactions |
| Attribution model comparison | Order quantity comparison using first-last interaction |
| Sales attributed to marketing | Sales and transaction history where marketing attributes (types and targets) can be tracked |
| Shop Campaigns performance | Reports where customer acquisition, revenue and conversion data throughout the marketing campaign was recorded |
8. Order reports
The purpose of Shopify order reports is to provide merchants with valuable insights and analytics regarding their sales transactions. These reports offer detailed information about orders placed on the Shopify platform, including metrics such as order volume, revenue generated, average order value, top-selling products, and customer demographics.
| Product orders and returns | Top-selling and returned product names and quantities within the selected period of time |
| Orders over time | Order quantity during a selected period of time |
| Fulfillment, shipping, and delivery times | Total and detailed time spent on fulfilling, shipping and delivering products |
| Fulfillment over time | Number of orders that have been finished fulfillment, delivery or shipping within a selected period of time |
| Shipping labels over time | Number and cost of labels made within a selected period of time |
9. Profit report
Within the profit report, businesses can track and identify the gross revenue that the sold products bring to them. This number excludes all the costs and fees associated with the orders.
| Profit by product | Gross profit of the products sold within a period of time. |
| Profit by Point of Sale location | Gross profit of products sold within a point-of-sale location |
| Profit by product variant SKU | Gross profit by variants |
10. Retail sales reports
Retail database from Shopify reports indicates the customer information together with their purchase history based on certain criteria like product name, SKU, staff at register, vendor, type or staff attributed to sale.
11. Sales reports
Sales report provides users with information about customer’s orders based on sales overtime, product or sales channel.
| Sales over time | Total orders and revenues made over time. |
| Sales by month | Total orders and revenues made every month. |
| Sales by day | Total orders and revenues made every day. |
| Sales by product | Breakdown of the product sales made over time |
| Sales by hour | Total orders and revenues made every day. |
| Sales by product vendor | Breakdown of product vendors and sales net quantity within a selected period of time |
| Sales by discount | Breakdown of sales generated from discount codes, fields included: discount method, discount type, discount code, discount amount, etc. |
| Sales by traffic referrer | Breakdown of sales via channels that customers are redirected from |
B. Choosing a third-party report tool for Shopify stores
Other than Shopify reports, many eCommerce brands on Shopify use third-party reporting tools to track data. However, these tools often struggle to establish flawless integrations and templates, leading to errors when generating reports for platforms like Shopify and Google services such as Google Analytics, Sheets, and Data Studio. The question here is, what to choose from the crowd?
1. Better Reports
Merchants are highly into this app because its strong, customizable reporting that’s much better than what Shopify provides. Easy to use and convert currencies, detailed reports on sales, inventory, and customer data, are what Better Reports help with accounting, managing inventory, and understanding customer behavior. People praise the support team for being quick to respond and for making custom reports.

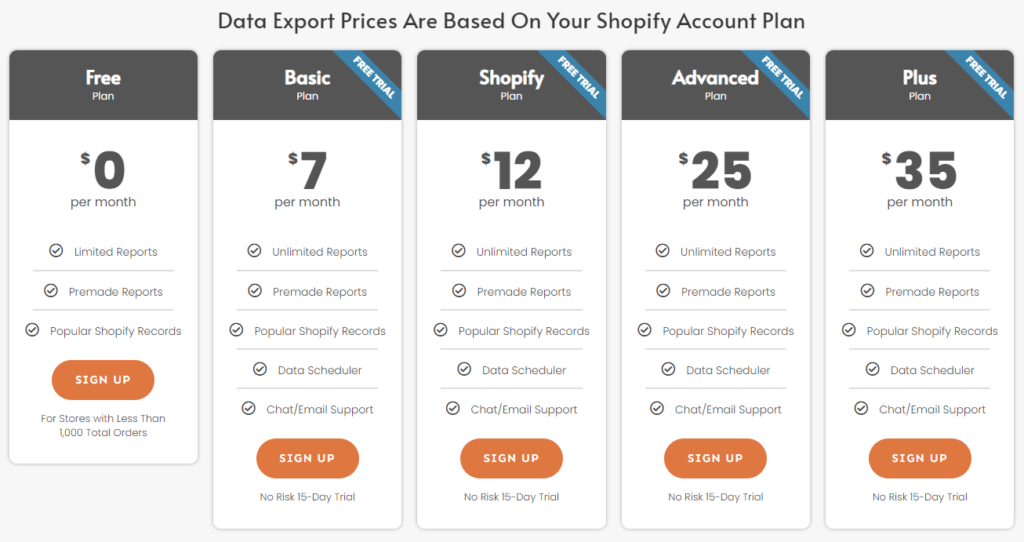
2. Data Export IO: Reports
As for the app’s advanced functionalities such as filtering, sorting, and scheduling, tasks are streamlined and efficiency is increased significantly. Data Export IO’s responsive support team stands out for their quick assistance and capacity to craft personalized reports. Users appreciate the app’s compatibility with diverse systems and file formats, including FTP transfers and Google Drive integration. Its ability to generate comprehensive reports, handle transaction reports for chargebacks, and access data not readily available in Shopify’s reporting tools earns praise.
3. Report Pundit
With 1,507 reviews with rates of 5.0 stars overall, Report Bundit proves itself to be the leading Shopify Reports enhanced version. Equipped with visualizing charts and graphs, custom fields, Paypal integration, live chat support & data export features, what businesses can take advantage of is to utilize pre-made reports for their unique demands and needs.

C. Closing words
Shopify Reports & Analytics, in short, present a powerful toolset for businesses to track and enhance their sales performance. With live insights and comprehensive data reports, businesses can gain valuable information to optimize their strategies and drive growth. The system offers a wide range of reports, from acquisition and behavior to finance and inventory, providing detailed metrics and analysis to inform decision-making. Additionally, third-party integrations and applications, or custom development parties offer further enhancements, allowing businesses to tailor their reporting to their specific needs.


